welcome to XRM blog

Keep in touch with latest CRM/ERP articles

To remain competitive your organisation must be efficient across the business process spectrum. To do so you need to take sound decisions based on a balance between the cost and risk. To do so you will be heavily dependent on your content management in itself needs...

image
Blog

Examining Victory Native: Producing Stunning Charts with React Native

By Anurag on 10/11/2023

React Native is a well-liked framework for creating mobile applications with React and JavaScript. Victory Native is an effective tool for data visualization in these kinds of applications. It is a collection of charts designed exclusively for React Native that offers a large selection of interactive and configurable chart elements.

In this blog post, we'll examine Victory Native in more detail and show you how to make eye-catching and educational charts for your React Native applications.

Getting started:

You must install Victory Native in your project before you can use it. Once the terminal is open, run:

- npm install victory-native --save

You can import Victory Native components into your React Native projects after they have been installed.

Making a Basic Chart

To start, let's create a simple line chart to show some example data.

We are importing the VictoryChart and VictoryLine components in this example. Each data point in our array (called data) has a value associated with it, both x and y. We render a VictoryLine component inside the VictoryChart using the given data.

Personalizing Chart

Many customization options are available in Victory Native to help you style and improve your charts. Here's an illustration of a bar chart with unique styling:

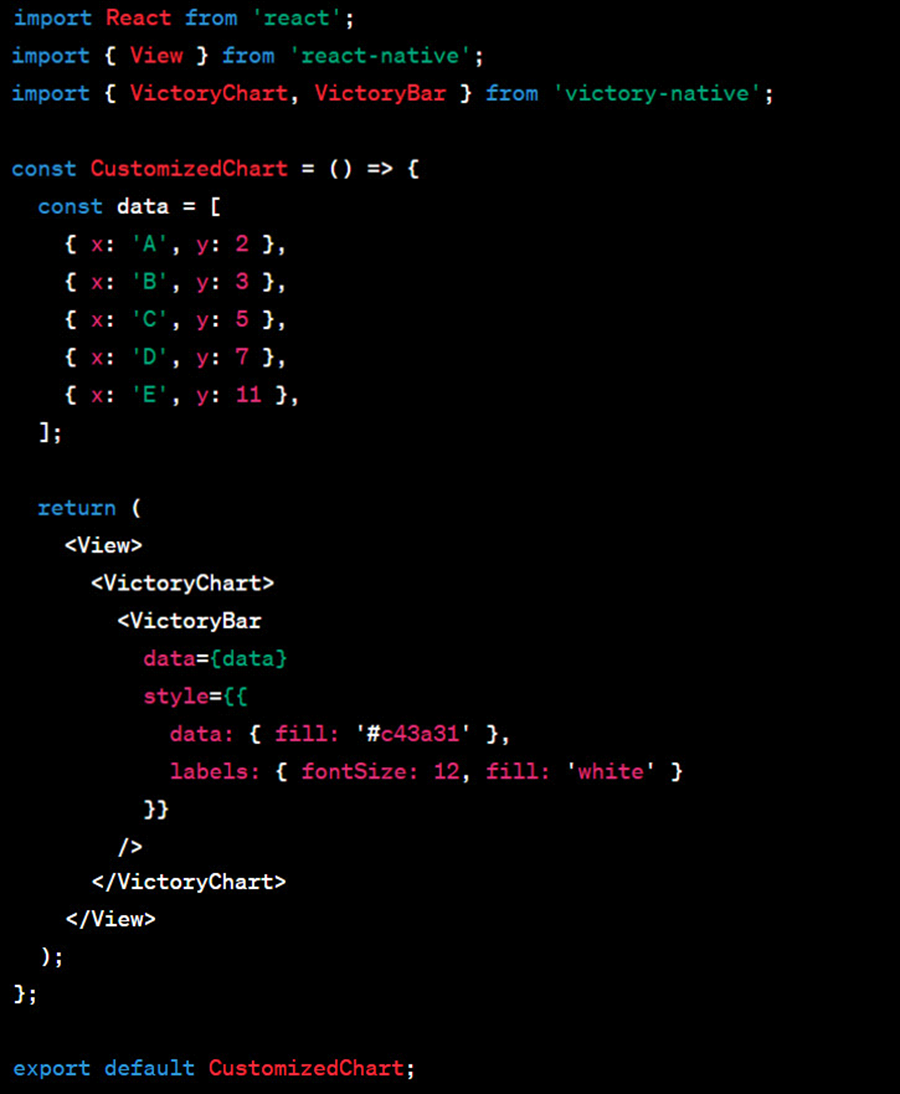
In this example, a bar chart is created using VictoryBar. Additionally, a style component has been introduced to alter the look of the labels and bars.

Interactivity

Tooltips and animations are examples of interactive components that Victory Native offers. This is an illustration of a line chart featuring tooltips:

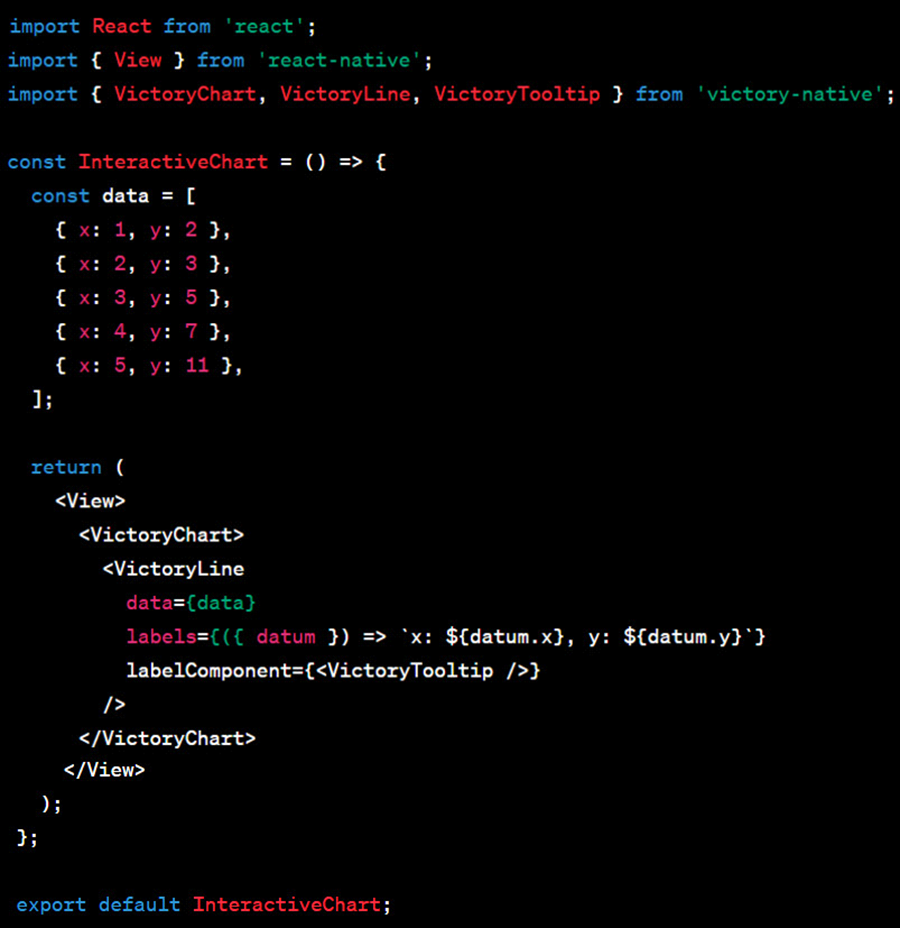
In this example, we have used the VictoryTooltip component to add tooltips to the data points. The tooltip's content is specified by the labels prop.

Conclusion

A strong tool for making visually appealing charts for React Native applications is Victory Native. You can make educational and engaging visualizations to improve your mobile apps with its extensive selection of components and customization choices. To choose which interactive feature, style, and chart type best represents your data, try a variety of experiments.

Examining Victory Native
Producing Stunning Charts with React Native
React Native
Author
Blog Calendar
Blog Calendar List
2024 Aug  4  1
2024 Apr  42  4
2024 Mar  84  4
2024 Feb  146  3
2024 Jan  24  7
2023 Dec  23  6
2023 Nov  248  5
2023 Oct  362  12
2023 Sep  952  9
2023 Aug  225  6
2023 Jul  45  6
2023 Jun  25  4
2023 May  44  5
2023 Apr  59  5
2023 Mar  159  6
2023 Feb  149  5
2023 Jan  59  4
2022 Dec  95  7
2022 Nov  277  2
2022 Sep  13  1
2022 Aug  32  2
2022 Jun  11  2
2022 May  6  2
2022 Apr  12  2
2022 Mar  2  1
2022 Feb  2  1
2022 Jan  1  1
2021 Dec  4  1
2021 Nov  2  1
2021 Oct  2  1
2021 Sep  14  1
2021 Aug  49  5
2021 Jul  50  4
2021 Jun  1575  5
2021 May  39  3
2021 Apr  2158  3
2021 Mar  207  5
2021 Feb  2437  7
2021 Jan  3602  9
2020 Dec  506  7
2020 Sep  80  3
2020 Aug  752  3
2020 Jul  134  1
2020 Jun  93  3
2020 Apr  85  3
2020 Mar  19  2
2020 Feb  34  5
2020 Jan  46  7
2019 Dec  17  4
2019 Nov  35  1
2019 Jan  23  2
2018 Dec  104  4
2018 Nov  68  3
2018 Oct  18  3
2018 Sep  1202  11
2018 Aug  7  2
2018 Jun  17  1
2018 Jan  70  2
2017 Sep  588  5
2017 Aug  17  1
2017 Jul  17  2
2017 Jun  64  2
2017 May  21  1
2017 Apr  38  2
2017 Mar  138  4
2017 Feb  818  4
2016 Dec  207  3
2016 Nov  884  8
2016 Oct  314  10
2016 Sep  752  6
2016 Aug  39  1
2016 Jun  1883  6
2016 May  111  3
2016 Jan  71  2
2015 Dec  595  6
2015 Nov  4  1
2015 Oct  13  1
2015 Sep  1470  6
2015 Aug  14  1
2015 Jul  128  2
2015 Jun  11  1
2015 May  20  1
2015 Apr  30  3
2015 Mar  80  3
2015 Jan  5342  4
2014 Dec  17  1
2014 Nov  2260  4
2014 Oct  69  1
2014 Sep  107  2
2014 Aug  5305  1
2014 Jul  49  2
2014 Apr  2588  12
2014 Mar  303  17
2014 Feb  221  6
2014 Jan  1510  16
2013 Dec  21  2
2013 Nov  693  2
2013 Oct  256  3
2013 Sep  11  1
2013 Aug  40  3
2013 Jul  214  1
2013 Apr  61  6
2013 Mar  2332  10
2013 Feb  131  3
2013 Jan  349  2
2012 Nov  61  2
2012 Oct  518  10
Tag Cloud
Interested in our services? Still not sure about project details? get a quote